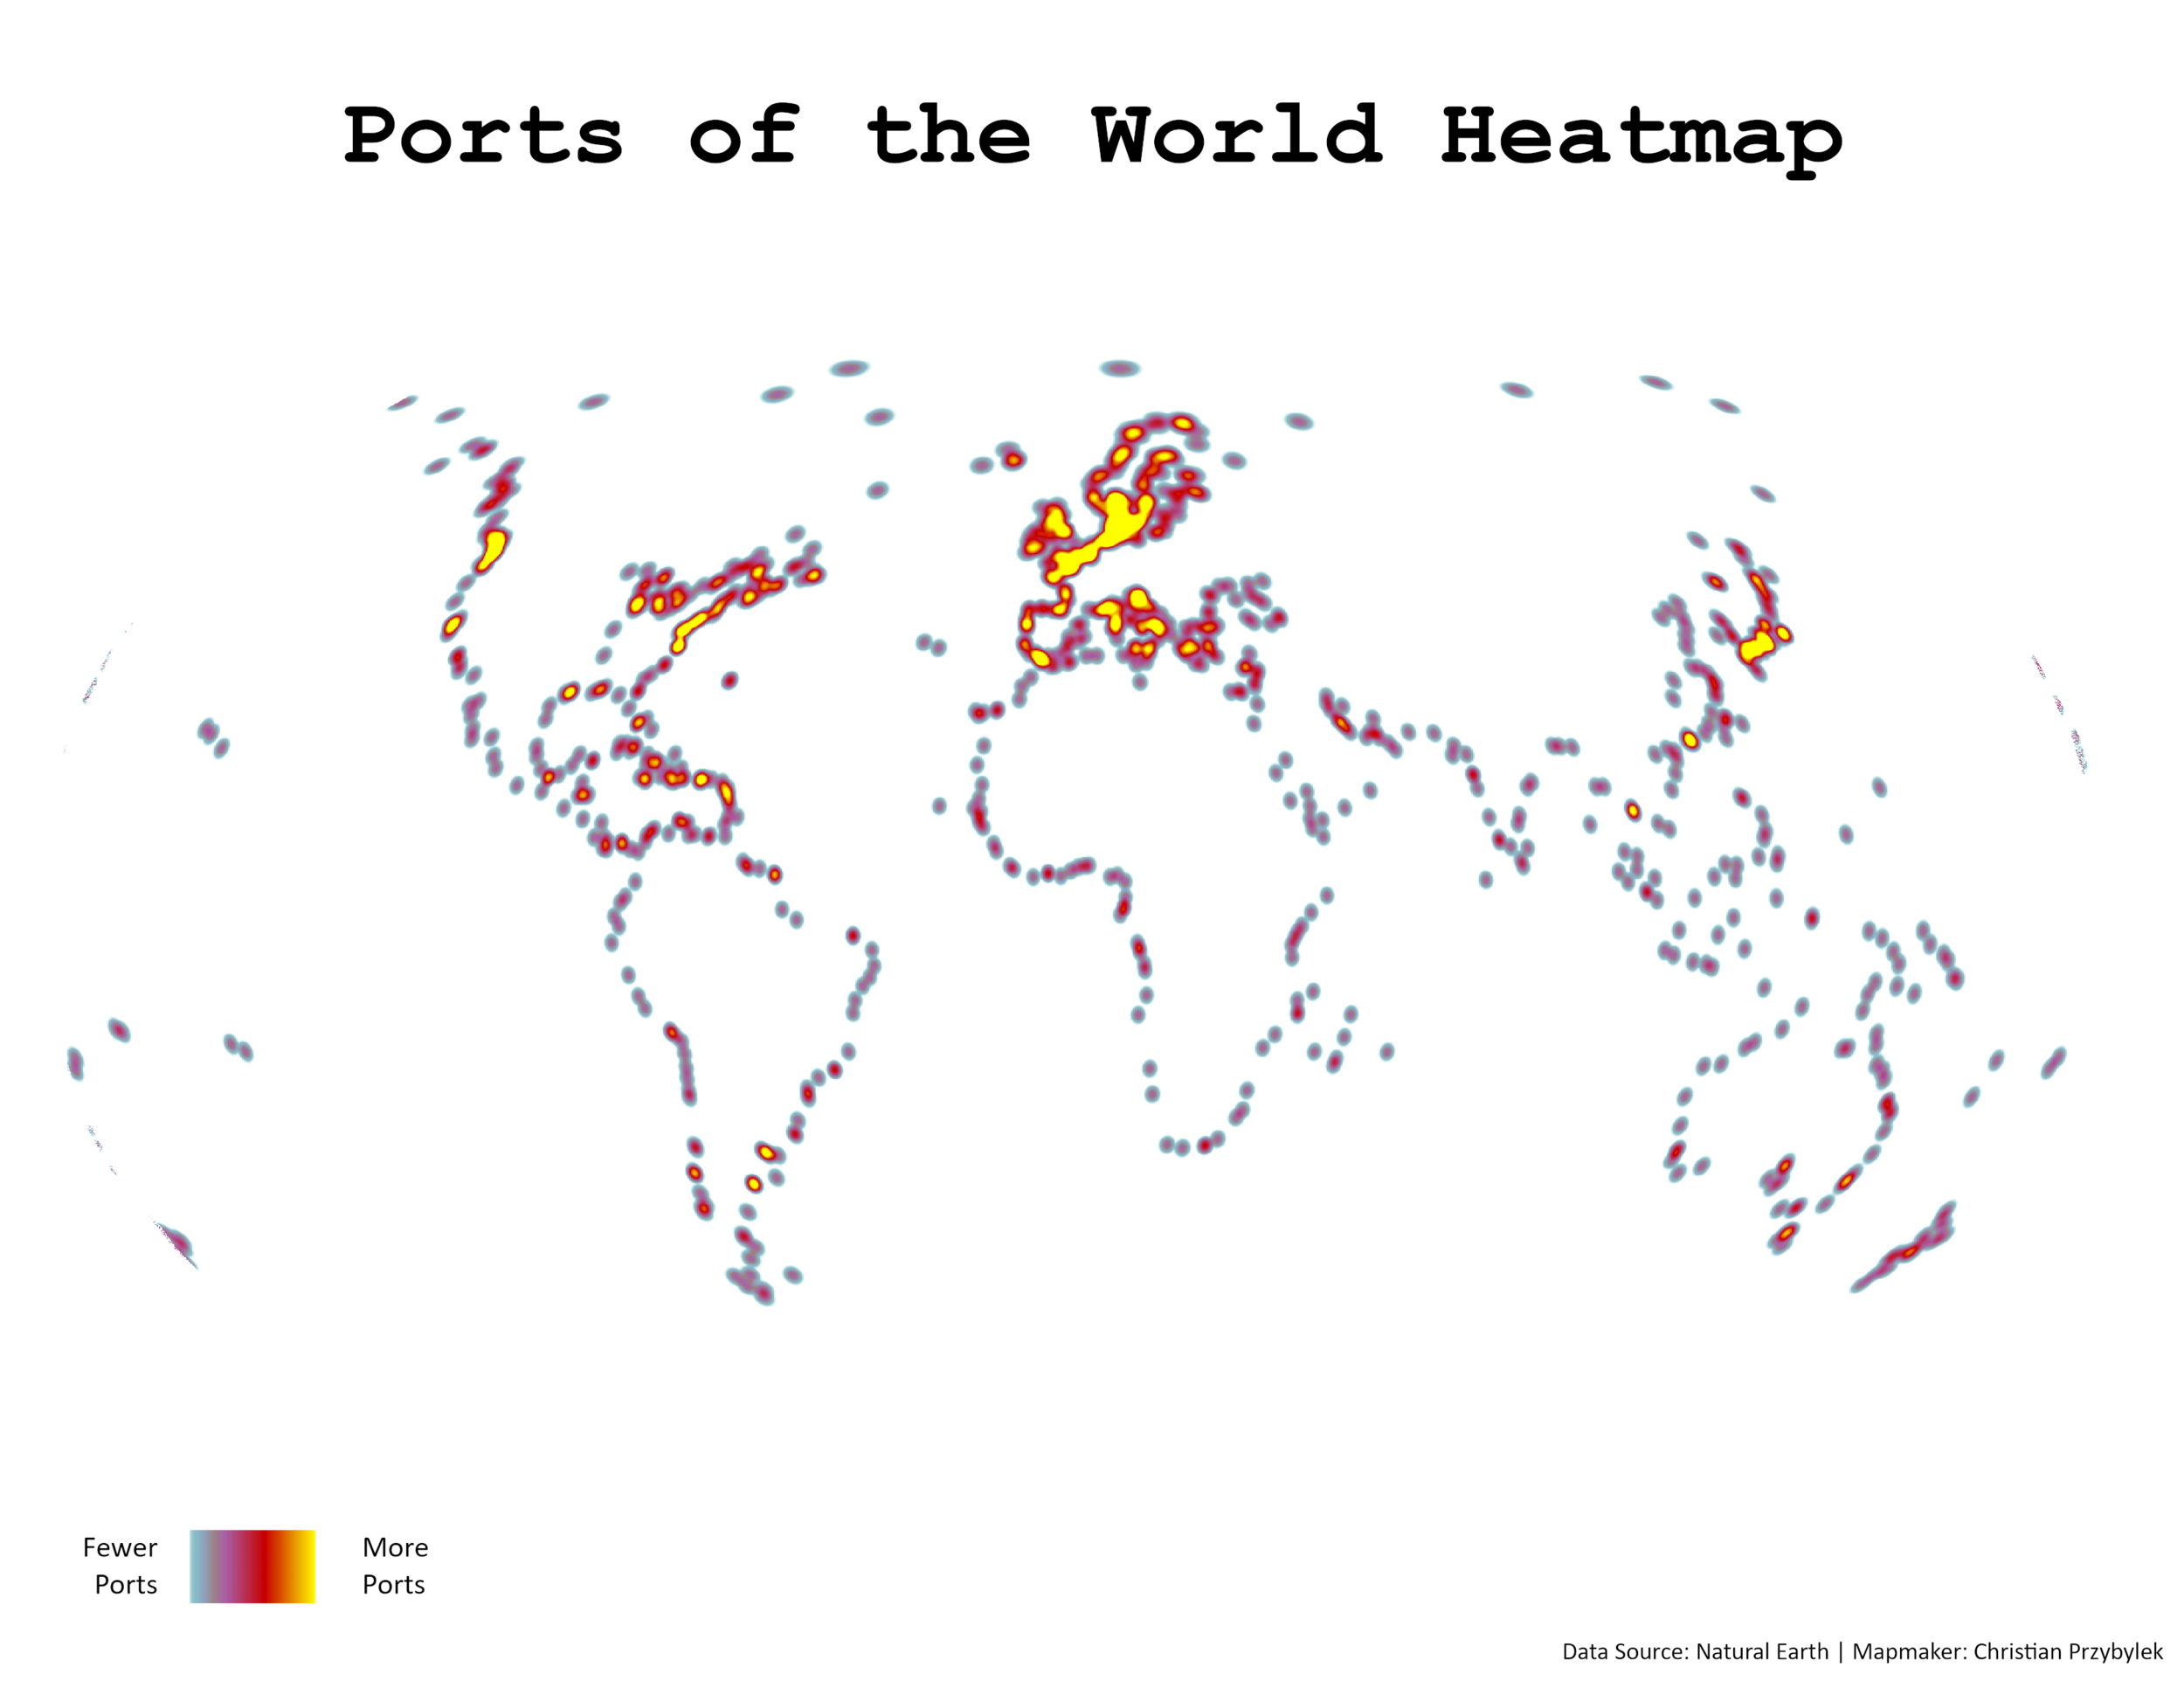
Day 27: Heatmap – Mapping the World’s Ports
A Heatmap of the World’s Ports
My mapping challenge for today was to make a heatmap. My approach for making today’s map was simple. To begin, I decided to pull in the world Ports layer from Natural Earth, an excellent repository of opensource GIS data that I used in day 13 of this 30 Day Mapping challenge to create my Roads of the World Map. In this map, I wanted to highlight the world’s coastlines by only showing the ports layer and visualizing it as a heat map. I decided on a minimalist design approach and left out all other features. No other geographic data is present. After I pulled in the ports layer in, I adjusted the heatmap symbology until I arrived at my final map. From this map, you can clearly make out the boundaries of the worlds oceans and major waterways.
